How To: Use the standards progress dashboard

Josh
Last Update viisi vuotta sitten
The standards progress dashboard provides an overview of how your students are doing on various learning standards.
There are two key filters for this view: a class filter and a standards category filter.
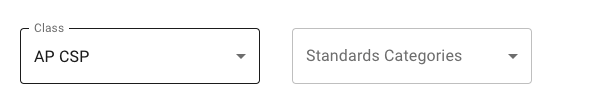
By default, your very first class will be selected in the class filter, and no standards categories will be selected, which means that you will see an average mastery for how each student in that class is doing for each standards category in your course.
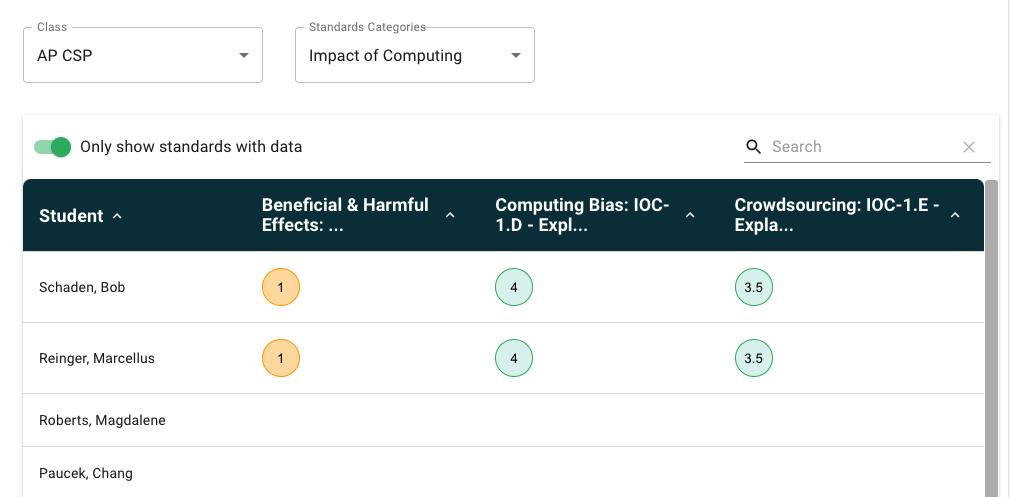
If you drill into a standards category, then you'll only see the performance data for the standards under that standards category:
How to read the mastery data
Each mastery data point represents the average number of times that a student has answered a question correctly in a row. Let's look at an example:
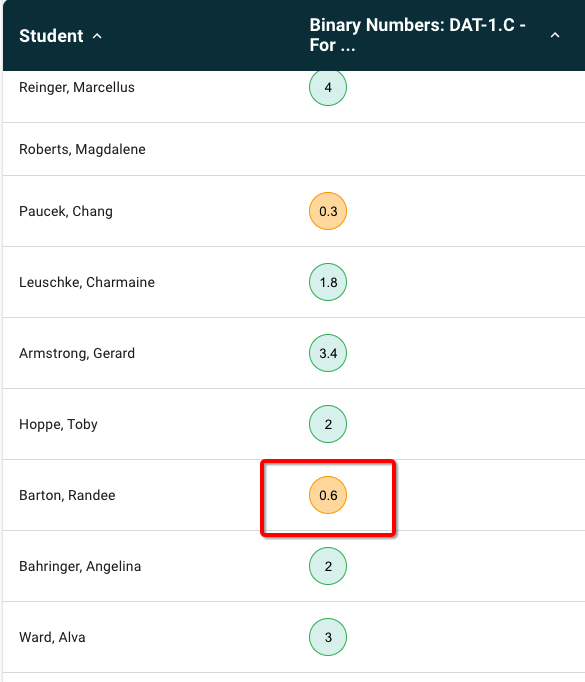
In this example, for the Binary Number learning standard, Randee has a mastery of 0.6. If we click into this data point, we can see that there are 5 questions on this learning standard.
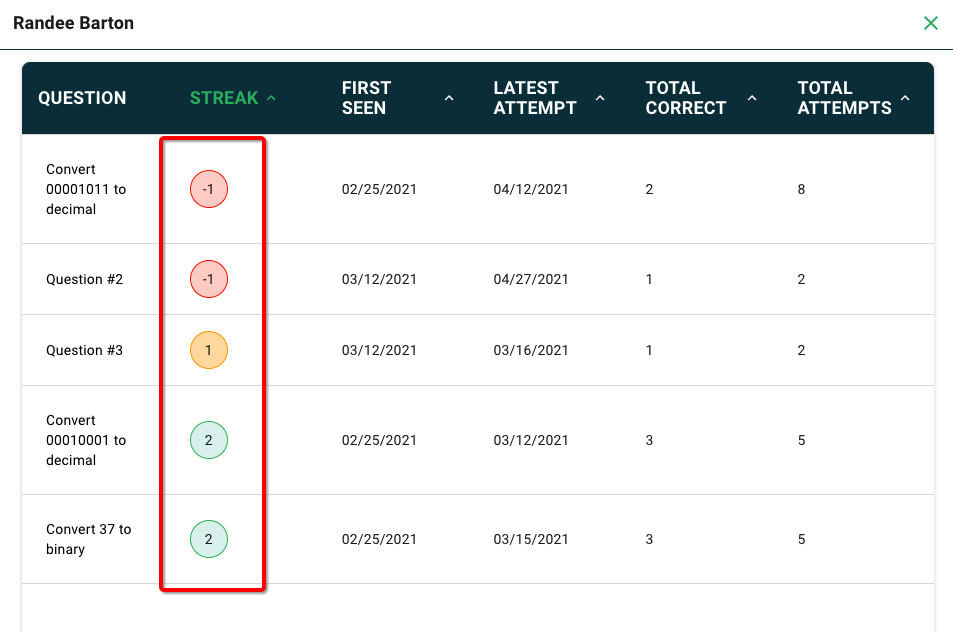
If we average his current streaks on each of those 5 questions, then we'll get the mastery of 0.6:
(-1 + -1 + 1 + 2 + 2) / 5 = 0.6
In summary, each mastery data point is just an average of a student's streaks on each of the questions under that learning standard. If we go back up one level to the standards category level, each of the data point there represents an average of the standards mastery under that category.